Marketing > Marketing Dashboard > Agent Performance Tile
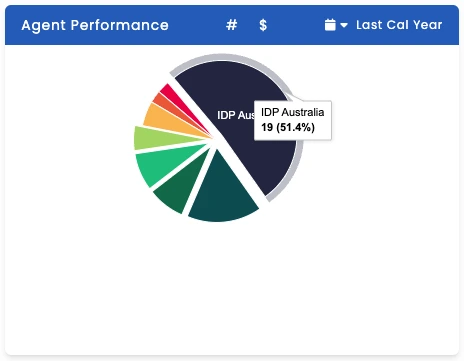
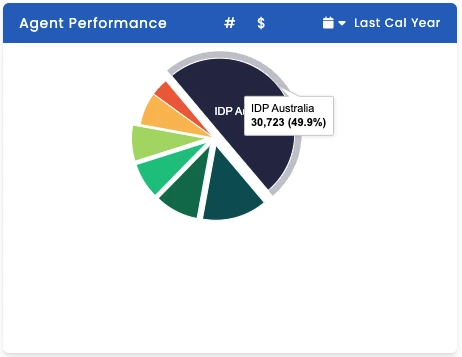
This pie chart depicts the information about the agent’s business performance, which includes the application and the invoice information. A user can change the date range to fetch the required information from the calendar icon in the top right corner of the tile.
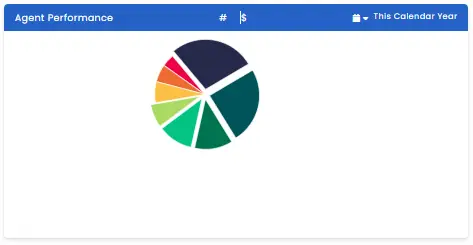
![]() This icon shows the total invoice amount of that particular agent.
This icon shows the total invoice amount of that particular agent.
The # icon shows the number of applications from a particular agent, and every segment of the pie chart opens the respective agent dashboard Agent Dashboard upon selection.